Independent AI audit · 25 parameters across 5 domains · equal weight
#Audit domainParameters assessedStatus
01
Software development lifecycle
5 parameters · awaiting evidence
Not yet audited
02
Product management
5 parameters · awaiting evidence
Not yet audited
03
Organization
5 parameters · awaiting evidence
Not yet audited
04
Security & privacy
5 parameters · awaiting evidence
Not yet audited
05
Implementation & support
5 parameters · awaiting evidence
Not yet audited
no score yet
Not yet audited
No audit on record yet. No score is not a low score.
Grafana Labs overview
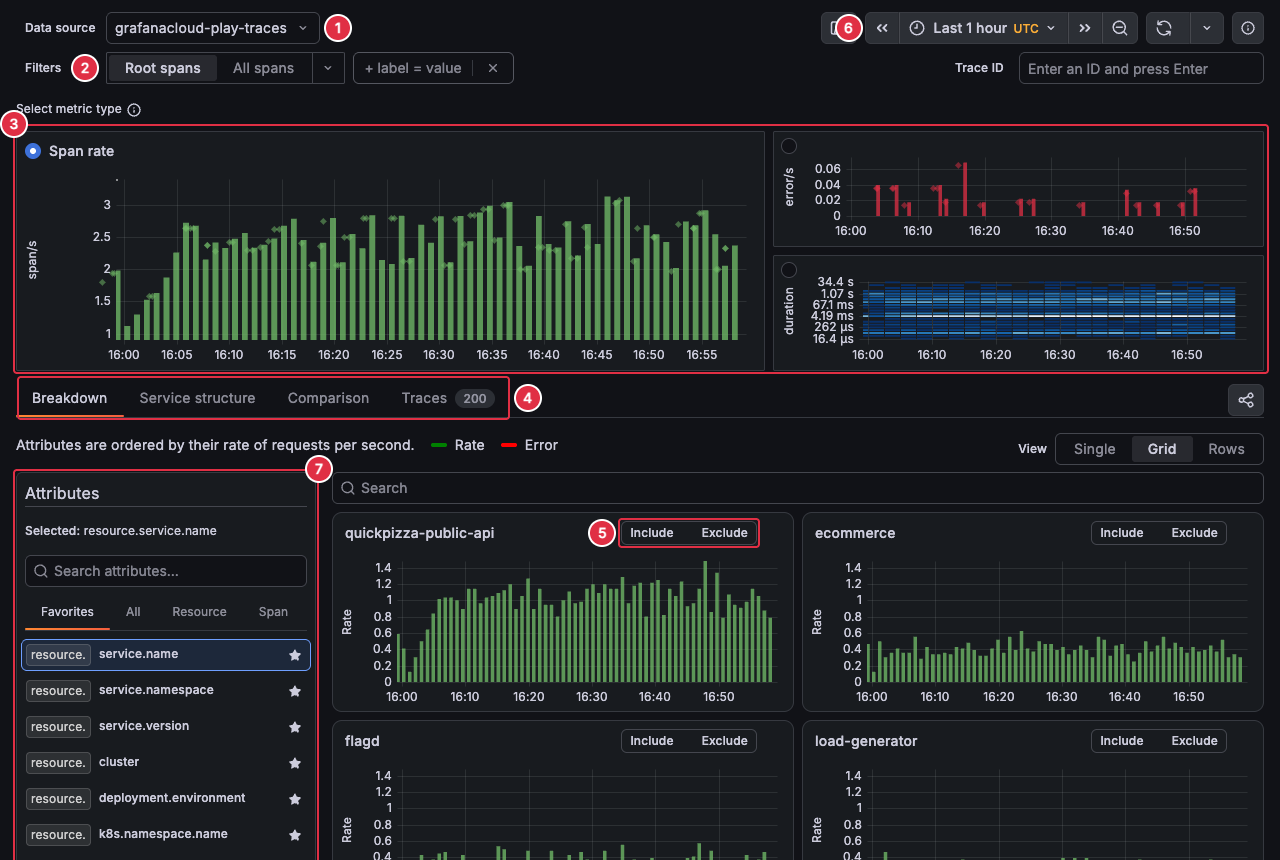
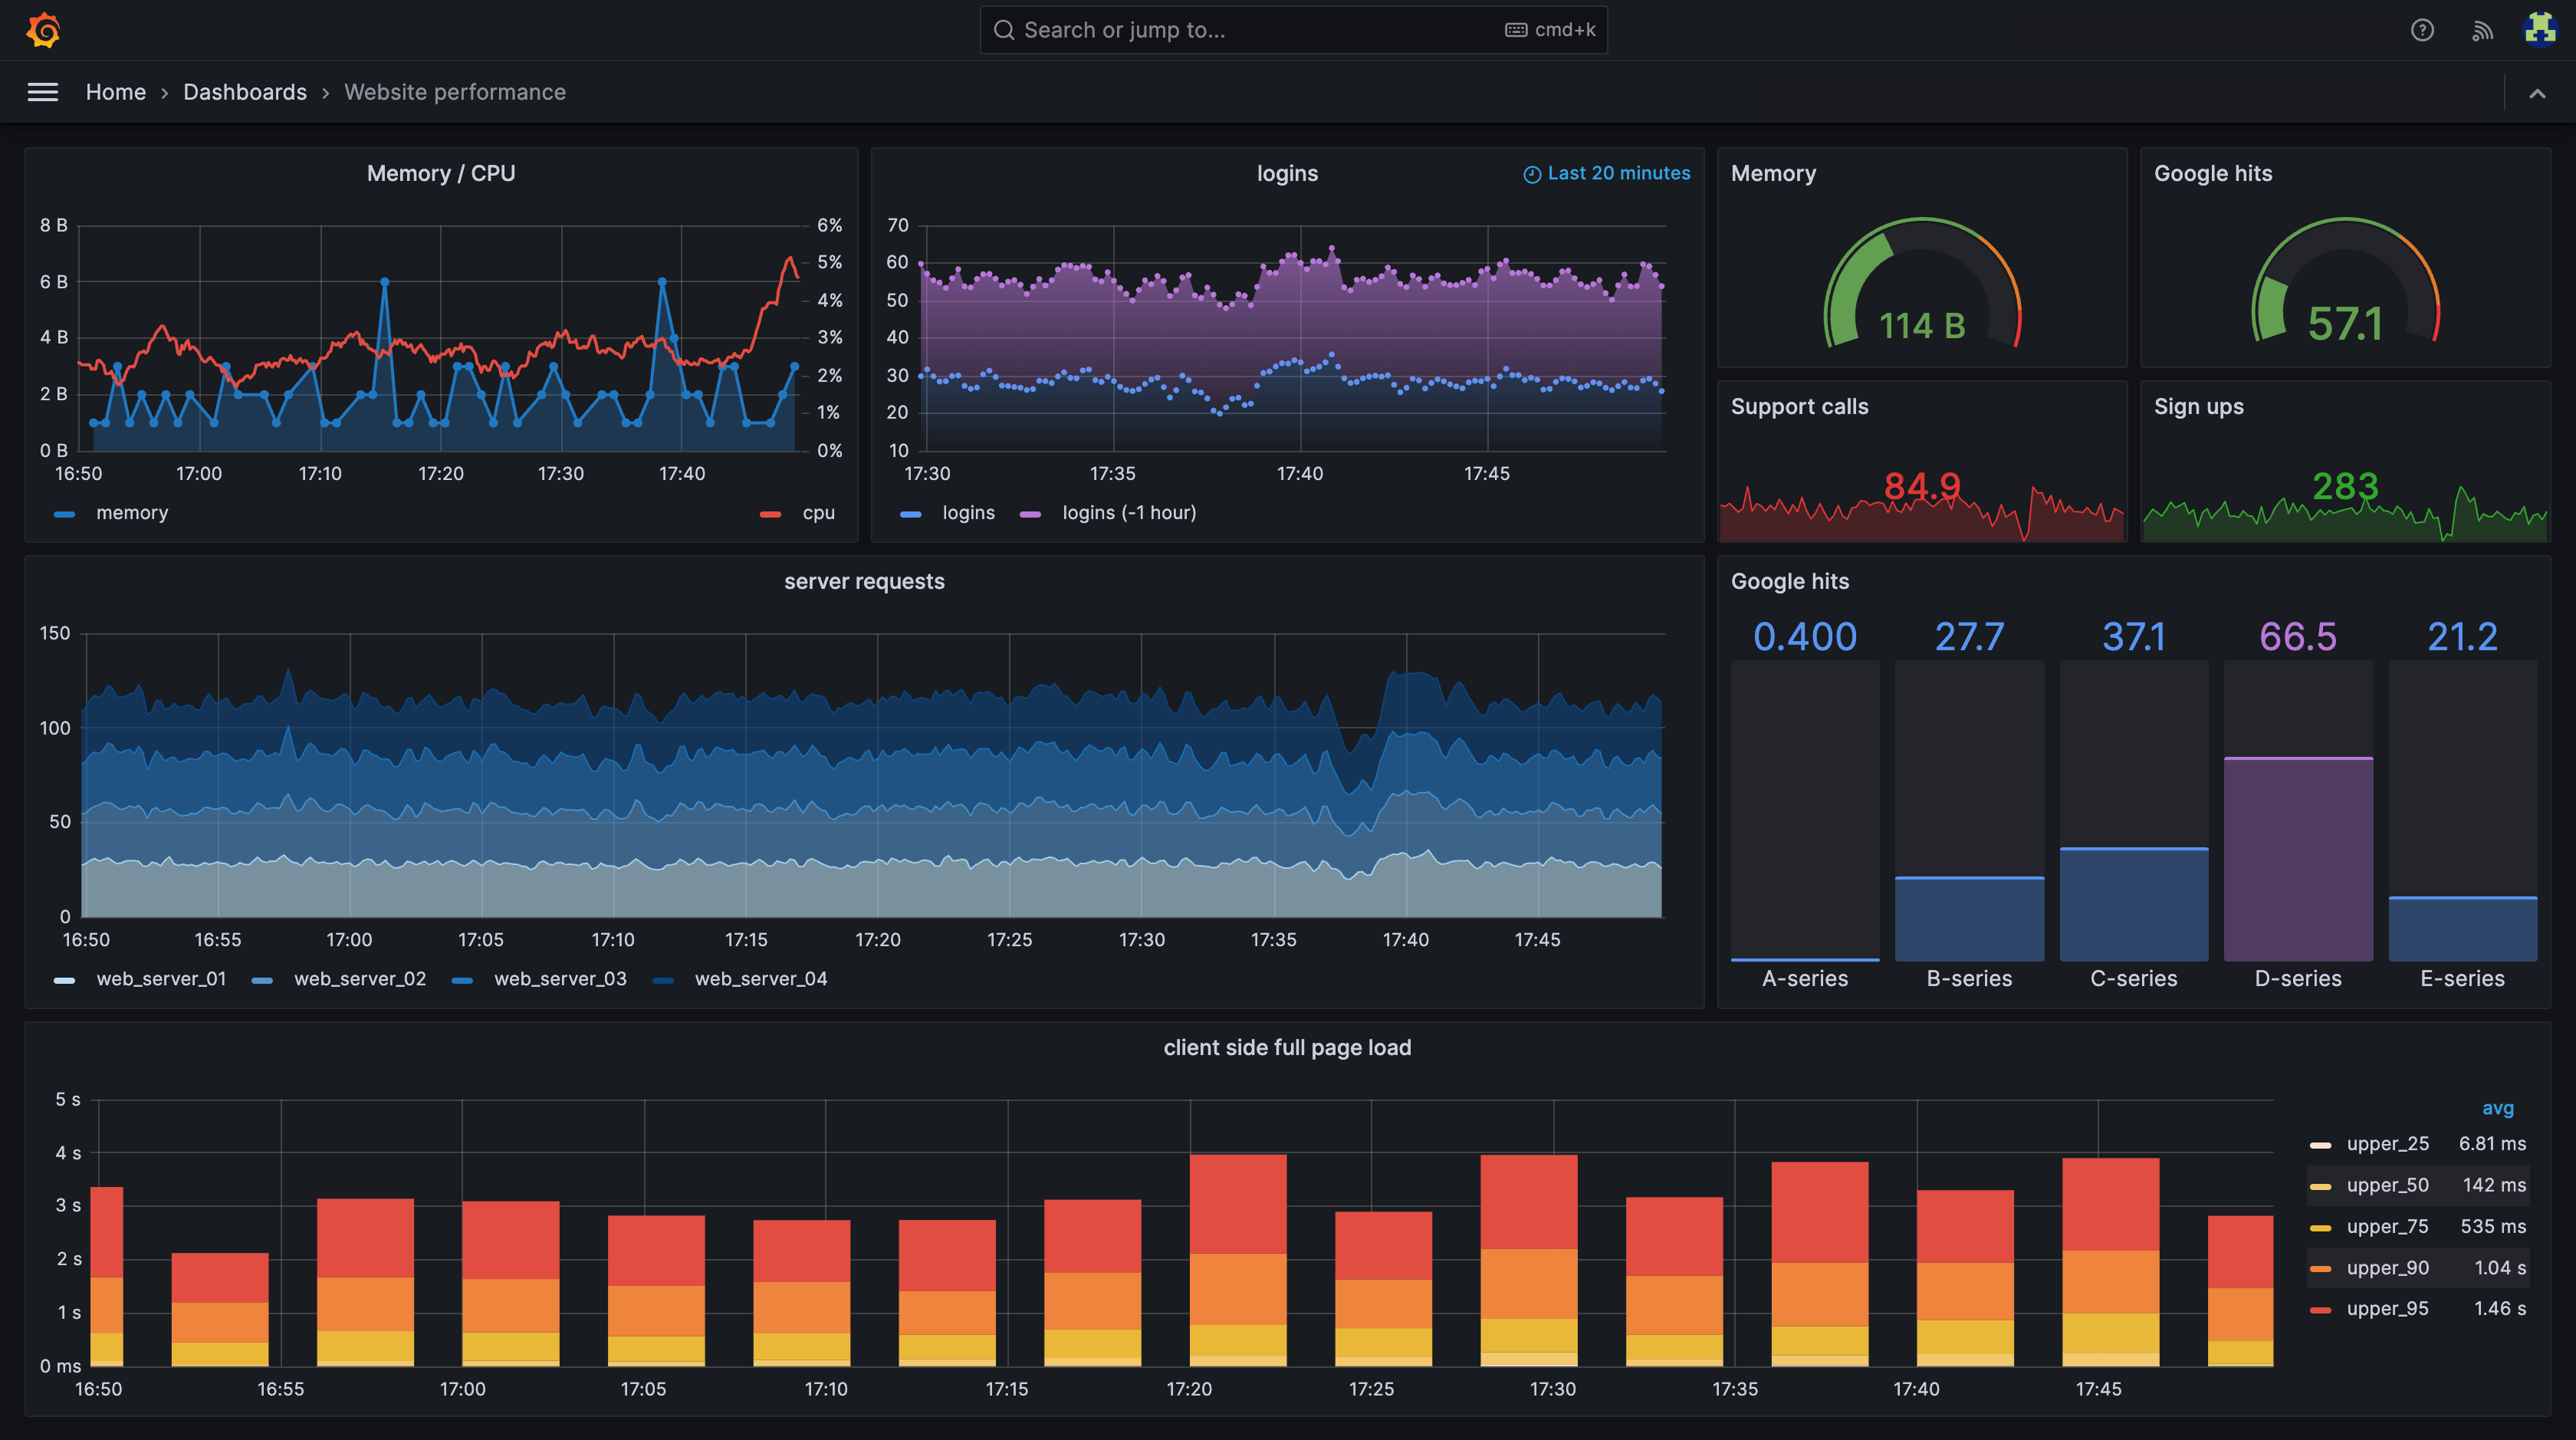
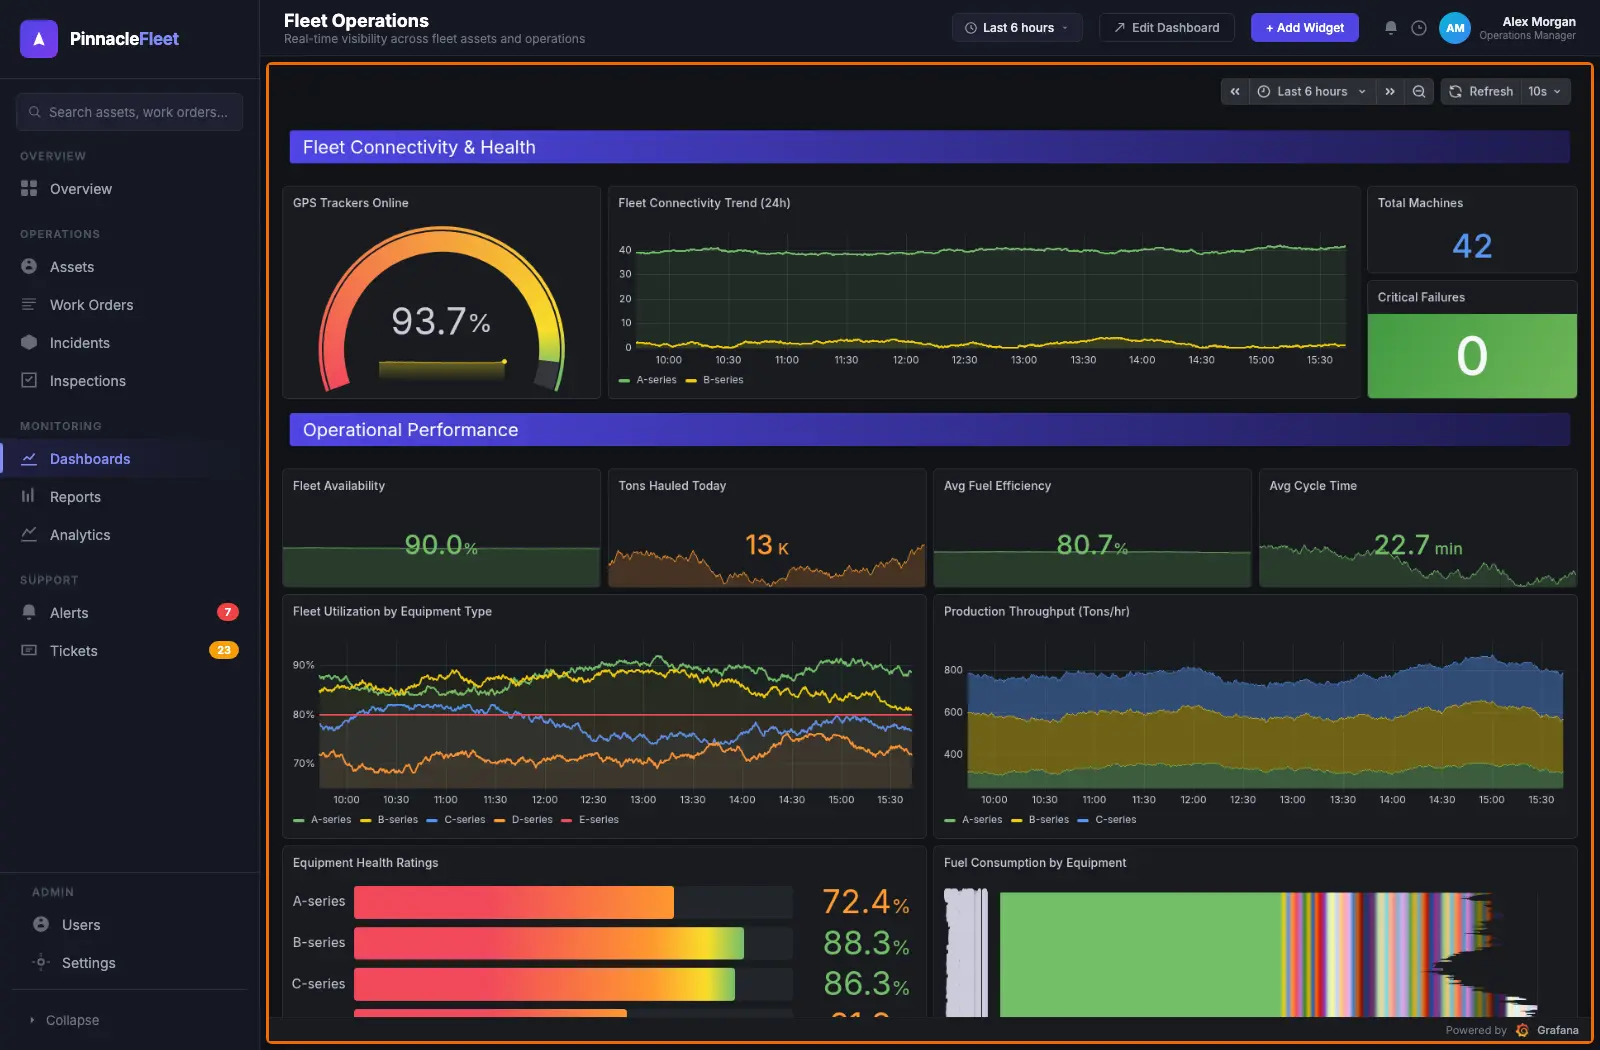
Grafana Labs is a leading observability software company that provides tools for monitoring, visualizing, and analyzing application, infrastructure, and business data. Its flagship platform, Grafana, enables teams to build interactive dashboards using metrics, logs, traces, and other data sources. Grafana supports integrations with popular technologies such as Prometheus, Kubernetes, Elasticsearch, PostgreSQL, and cloud platforms.
The Grafana platform provides a unified view of system health and performance through customizable dashboards, charts, alerts, and visualizations. Grafana Cloud extends these capabilities as a managed observability platform, offering metrics, logs, traces, profiles, and application monitoring without requiring organizations to maintain the underlying infrastructure. Teams can create alerts based on defined thresholds and investigate issues using correlated telemetry data.
Grafana Labs is widely used by DevOps, SRE, engineering, and IT teams to improve visibility across complex technology environments. Its open-source ecosystem, extensive integrations, flexible dashboards, and scalable cloud offerings make it suitable for organizations ranging from small development teams to large enterprises. Grafana helps teams detect problems faster, understand system behavior, and maintain reliable digital services.
Media
Screenshots and product photos shared by Raintank, Inc..
Click to enlarge1 / 3
Company Information
New York, United States / Stockholm, Sweden
Vision
A world where anyone can observe anything, openly — where the world's most popular open dashboards unify metrics, logs and traces from any source, without lock-in to a single vendor's data.
Mission
We build the open observability stack around Grafana, so teams visualise and analyse metrics, logs and traces from any data source in one place — open, composable and free of lock-in.
Leadership team
Meet the leaders shaping our vision, product, and growth.
No leadership team has been added for this product yet.
Compliance
Our certifications and compliance frameworks that keep your data safe.
SOC 2 Type II
ISO 27001
GDPR
Pricing
All plans include core features. Per month, billed annually.
Free
For 14 days
$0/always
All Grafana Cloud services, with limited usage
Community support
14 days retention for metrics, logs, traces, profiles, & k6 performance tests
Pro
$19/month
Pay as you go above the Free tier
8X5 email support
13 months retention for metrics; 30 days retention for logs, traces, profiles, & k6 performance tests







 All Grafana Cloud services, with limited usage